
History
Established 1990: The H-1B specialty occupation visa was created by the Immigration Act of 1990, signed November 20, 1990. It split the old H-1 category into H-1A (nurses) and H-1B (high-skill professionals).
Initial Cap: A quota of 65,000 new H-1B visas per fiscal year was set for the first time in 1990. (In 2004, an extra 20,000 slots for U.S. advanced-degree holders were added, totaling 85,000 new visas yearly.)
Early Adjustments: Congress temporarily raised the cap to 115,000 (FY1999–2000) and 195,000 (FY2001–2003) during the dot-com boom. Since FY2004, the base cap returned to 65k (plus 20k master’s) and remains at that level.
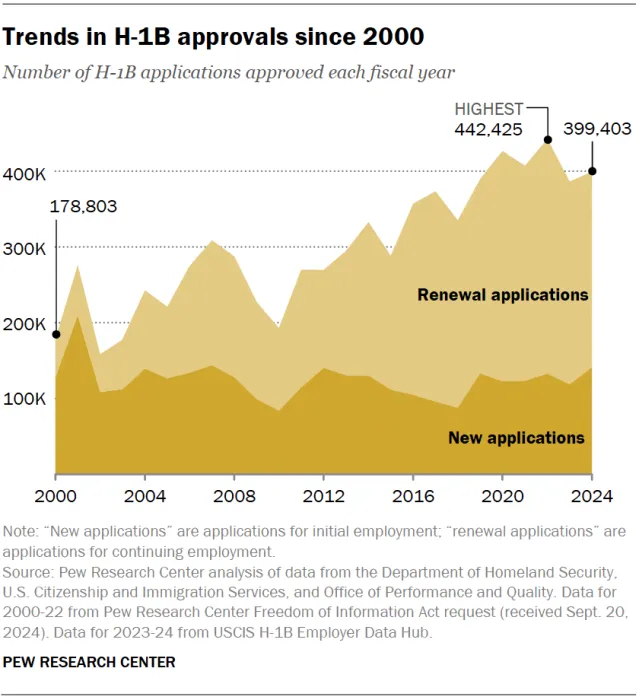
H1B Approval Trends:
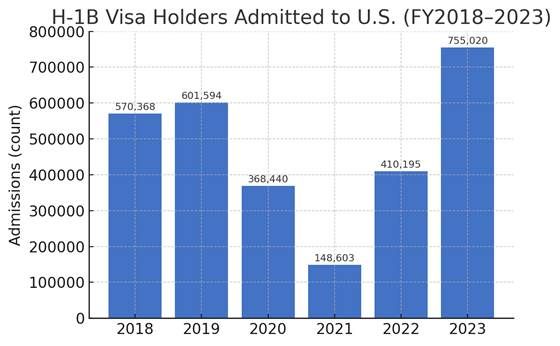
Entry Stats (FY2018–2024)
FY2018: ~570,000 admissions
FY2019: 601,594 (pre-COVID peak)
FY2020: 368,440 (travel bans hit)
FY2021: 148,603 (pandemic low)
FY2022: 410,195 (rebound)
FY2023: 755,020 (record high)
H-1B visa holders admitted to the U.S. each year. Admissions = The number of times H-1B holders enter the U.S. in a year (counted at ports of entry). One person may be admitted multiple times if they travel abroad and return.
Current Population
Around 600,000 to 700,000 H-1B workers live and work in the U.S.
Education: 55%+ hold a Masters degree or higher.
Salary: Median ~$118,000 (FY2023).
Fields: Overwhelmingly STEM and tech roles, filling critical shortages.
Transfers & Renewals (USCIS Petitions)
FY2024 Approvals: ~400,000 petitions.
New Employment: ~141,200 (35%)
Continuing Employment (renewals + transfers): ~258,200 (65%)
Transfers Alone: ~64,000 petitions in FY2024.
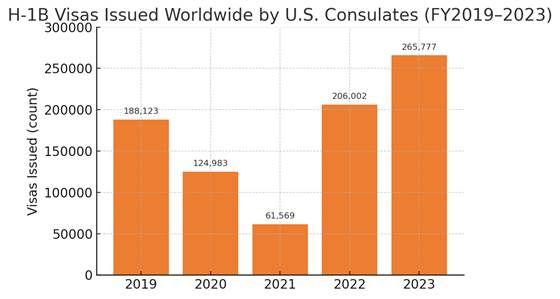
Global Visa Stamping
FY2019: ~188,000 visas issued
FY2020: ~125,000
FY2021: 61,569 (pandemic low)
FY2022: 206,002
FY2023: 265,777 (record high)
H-1B visas issued worldwide at U.S. consulates.
Revenue from H-1B Fees
Employers shoulder hefty costs per petition:
Base filing fee: $460
Fraud prevention: $500
Training fee (ACWIA): $750–$1,500
Premium processing (optional): $2,500
2026 Update: Rising Cost of H1B Sponsorship
- Employers are facing higher total costs per petition
- Increased wage requirements and compliance scrutiny
- Result:
- Fewer low-value filings
- More focus on high-impact roles
Annual intake:
~$400M from training/fraud fees
~$180M from base fees
~$500M+ from premium processing
≈ $1B/year in fees, funding USCIS and U.S. worker training.
H-4 Visa (Dependents)
FY2023 Issuances: 186,748 (up from ~137k in 2022).
Revenue: ~$35M in consular fees (not counting U.S. extensions).
Population: ~550,000 spouses + children in the U.S.
Profile: Majority are educated women; many have advanced degrees.
H-4 EAD (Work Authorization for Spouses)
Since 2015: Eligible H-4 spouses can work if the H-1B spouse is in the green card process.
Approvals: 171,000+ spouses approved by 2022; ~100,000+ working today.
Impact: Adds $5.5B to GDP and $2.5B in taxes annually.
Retention Factor: 90% of H-4s say work rights are “very important” to staying in the U.S.
2026 Insight
- H4 EAD continues to be a critical retention factor
- Ongoing policy discussions create uncertainty
- Still a major contributor to:
- workforce participation
- household income stability
Tax Contributions (2020–2024)
Federal: ~$24B annually from H-1Bs → ~$120B over 5 years.
State & Local: ~$11B annually → ~$55B over 5 years.
Total: ~$175B (2020–24) contributed by H-1B workers.
Beyond taxes: H-1Bs own 300k+ homes and 1M+ vehicles, deepening local economic impact.
2026 Economic Perspective
H1B workers remain key contributors to:
- federal and state taxes
- housing markets
- local economies
“They are long-term economic participants, not short-term workers”
Immigrant-Founded Unicorns
Immigrants, many once H-1B holders, have built some of America’s most valuable startups:
SpaceX – Elon Musk (South Africa)
Stripe – Collison brothers (Ireland)
Instacart – Apoorva Mehta (India/Canada)
Databricks – Ali Ghodsi (Iran/Sweden), Ion Stoica (Romania)
Epic Games – Mark Rein (Canada)
Miro – Andrey Khusid (Russia)
Discord – Stanislav Vishnevskiy (Ukraine)
Grammarly – Max Lytvyn & Alex Shevchenko (Ukraine)
Faire – Daniele Perito (Brazil)
Zoom – Eric Yuan (China, after 8 visa denials!)
55% of U.S. unicorns are immigrant-founded, proof of the H-1B pipeline’s multiplier effect.
Immigrant entrepreneurs, many beginning as H-1B workers or students have built over half of America’s billion-dollar startups, driving innovation, creating jobs, and even leading Fortune 500 companies like Google and Microsoft.
2026 Insight
- The H1B pathway continues to act as a pipeline for innovation and entrepreneurship
- Many founders start as:
- students → H1B → entrepreneurs
What This Means for H1B Applicants in 2026
- Focus on specialized, high-demand skills
- Target strong, compliant employers
- Prepare early for registration
- Avoid generic roles
Sources:
Official USCIS, DHS, and State Department data; Pew Research Center, NFAP, FWD.us analyses; and other cited reports for FY2018–2024 statistics and facts. All statistical claims are backed by the cited sources above.